Share:
What Is Driving Changes in Global Fertilizer Prices in 2026?
Fertilizers pricing intelligence covers nitrogen, phosphate and potash fertilizers.

Fertilizers Pricing Intelligence - Executive Summary
Fertilizers pricing intelligence covers nitrogen, phosphate and potash fertilizers. Fertilizer markets showed contrasting regional trends in July 2026. China’s domestic nitrogen market remained soft, with urea gradually weakening and ammonium sulfate easing after a brief mid-month recovery. In contrast, the global seaborne urea market strengthened due to constrained Middle Eastern exports, higher European production costs, and renewed importer activity. Phosphate and potash markets remained comparatively stable, with MAP, MOP, potassium nitrate, and SOP showing limited price movement amid adequate supplies and cautious procurement. Regional policies also influenced demand, with India maintaining comfortable Kharif supplies through domestic production and imports, while European countries introduced support measures to address rising fertilizer and energy costs.
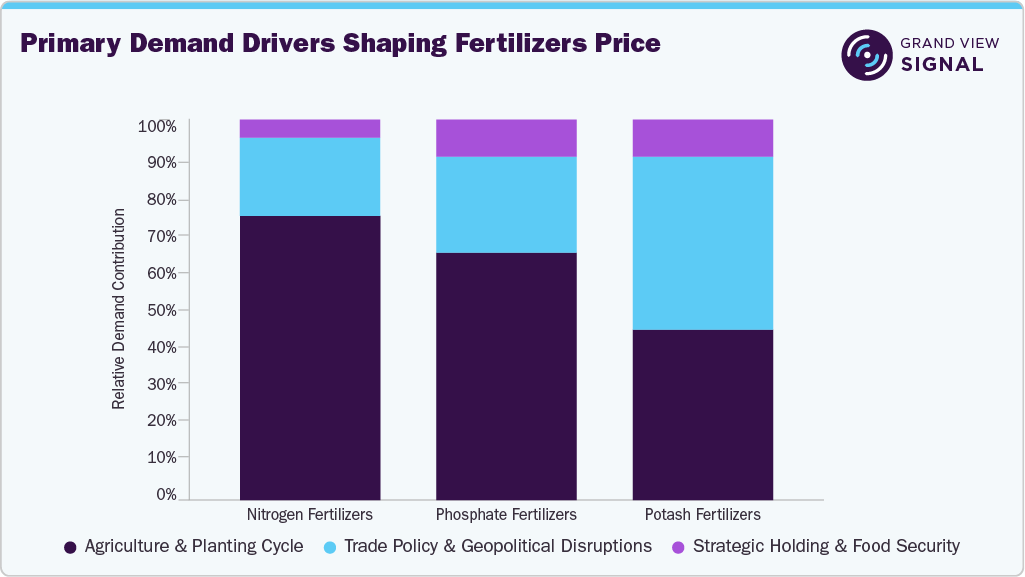
Key Price Developments & Insights
- Urea prices weakened in China but strengthened in the seaborne market amid tighter global supply.
- Ammonium sulfate declined early, briefly recovered mid-month, then weakened again.
- MAP remained stable, while MOP, potassium nitrate, and SOP showed stable to slightly weaker trends.
- Government procurement, affordability, Middle Eastern disruptions, and cautious inventory management remained key price drivers.
Top Performing Fertilizers Commodity
- Top Mover: Ammonium Biphosphate
- Average MoM Growth (top 3 geographies): 1.0%
- Volatility Level: Stable
Schedule a free demo of Grand View Signal to get real-time preview of price fluctuations in the Fertilizers Sector
Fertilizers Sector Coverage and Key Price Influencers
1. Nitrogen Fertilizers
The category includes Urea and Ammonium Sulfate, with July prices influenced by domestic supply, ammonia and natural gas costs, exports, seasonal demand, and government procurement.
Key Pricing Influencers:
- Natural-gas and ammonia availability
- Domestic production and plant operating rates
- Export policy and seaborne supply
- Agricultural procurement and inventories
2. Phosphate Fertilizers
The category includes MAP, which provides nitrogen and phosphorus. July pricing was shaped by phosphate rock, Sulphur, ammonia, and phosphoric acid costs, producer output, exports, and seasonal demand.
Key Pricing Influencers:
- Phosphate-rock and phosphoric-acid availability
- Ammonia and Sulphur costs
- Chinese export availability
- Agricultural and compound-fertilizer demand
3. Potash Fertilizers
The category includes MOP, Potassium Nitrate, and SOP, serving bulk, horticultural, fertigation, and chloride-sensitive applications. July prices were influenced by producer supply, imports, affordability, inventories, and specialty-crop demand.
Key Pricing Influencers:
- Major producer and import availability
- Crop economics and application timing
- Freight and regional import costs
- Demand from specialty and chloride-sensitive crops
Get historical, current, and forecast fertilizers price assessments. Request Free Access to Grand View Signal
Pricing Trends, July 2026
- Nitrogen Fertilizers
Nitrogen fertilizers showed the greatest regional divergence in July. China’s urea market gradually weakened amid adequate domestic supply and limited purchasing, while the seaborne market strengthened due to increased activity and constrained Middle Eastern supply. Ammonium sulfate declined early in the month, briefly recovered mid-month, then weakened again, reflecting continued domestic market weakness and varied international supply conditions influenced by caprolactam production, coke-oven by-products, export economics, and agricultural demand.
- Phosphate Fertilizers
MAP remained comparatively stable in July, with China’s domestic market showing limited movement and a narrow trading range as adequate supply and cautious purchasing limited price momentum. International phosphate markets remained sensitive to ammonia, Sulphur, phosphoric acid, and trade-flow risks, while Chinese export restrictions constrained flexible supply. Morocco’s capacity and partnership developments improved the longer-term outlook but did not immediately ease short-term raw-material and logistics constraints.
- Potash Fertilizers
Potash fertilizers remained broadly stable to slightly weak in July. MOP stayed steady initially before softening in the third week and stabilizing at a lower level, reflecting measured purchasing and adequate availability. Potassium nitrate and SOP also traded within narrow ranges, with limited movement driven mainly by confirmed specialty-crop demand, including horticulture, fertigation, and chloride-sensitive crops.
Access commodity-wise monthly forecast datasets for the next 6 months. Request Free Access to Grand View Signal
Fertilizers Key Market Drivers
- Divergence Between China and Seaborne Nitrogen Markets: China’s domestic urea market remained soft in July due to adequate supply and limited purchasing, while international prices strengthened amid import demand, Middle Eastern supply restrictions, higher European gas costs, and rising delivered costs. A limited reopening of Chinese exports provided some supply but did not offset global disruptions, keeping international replacement costs elevated.
- Middle Eastern Supply, Gas Costs, and Logistics: Middle Eastern supply disruptions continued influencing fertilizer markets, particularly nitrogen and phosphate. Limited ammonia exports, higher European gas costs, and shipment constraints increased replacement costs, while diversified production and logistics helped maintain supplies. Importers responded by diversifying sources and increasing supply buffers where possible.
- Kharif Demand and Supply Management in India: India’s Kharif season supported fertilizer demand, while domestic production, imports, tenders, and long-term agreements maintained adequate supplies of urea, phosphate, and potash. Comfortable stocks and government supply monitoring limited shortages and prevented excessive procurement pressure despite elevated global freight and feedstock costs.
- Phosphate Raw Materials and Export Availability: Phosphate markets remained sensitive to ammonia, Sulphur, phosphate rock, and phosphoric acid availability. Middle Eastern disruptions and Chinese export restrictions increased supply risks for international buyers, although China’s MAP prices remained stable. Moroccan phosphate partnership developments improved the long-term supply outlook but did not immediately ease raw-material and logistics constraints.
- Adequate Potash Availability and Selective Demand: Potash markets remained more stable than nitrogen, supported by adequate MOP availability and disciplined purchasing. SOP and potassium nitrate demand remained selective, driven mainly by specialty and chloride-sensitive crops. Adequate stocks and controlled procurement limited the impact of freight and import costs on domestic prices.
Get detailed driver impact analysis on fertilizers prices. Request Free Access to Grand View Signal
Grand View Signal offers
Grand View Signal tracks 200 commodities across multi-countries and reconstructs the price history back to 2016. This way, decision-makers can see not just what a material costs, but the drivers impacting the same. The offering includes commodity price capture across 8 sectors.
- Weekly Commodity Pulse - What changed across commodity markets this week - the panoramic view, in five minutes.
- Why Prices Moved - A single commodity, taken apart. Every driver, ranked, with the causal chain traced.
- Risk Watch - What could disrupt supply in the next four to eight weeks, with exposure graded.
- Decision Brief - The stance, the triggers that would change it, and the six-month forecast.
Explore Grand View Signal and access the full commodity price database and analyst forecasts.
Read our latest article on how Grand View Signal can assist procurement team with EU PPWR compliance
Share:
More in Business
View category17 Reliable Platforms to Buy Verified Ally Bank Accounts in Fast (De) 2027
Contact Section:👇👇 ╰┈➤🔎Telegram: Getkycit ╰┈➤🔎 Telegram: Getkycitofficial ╰┈➤🔎WhatsApp: +1 (343) 342-5919 ╰┈➤🌐 Website Visit Now: Getkycit.com
READ ARTICLEHow to Choose the Right Carry-On for Stress-Free Travel
Travel can be exciting, but packing for a trip is often where the stress begins. I have found that choosing the right bag before leaving home can make a noticeable difference throughout the journey.
READ ARTICLE21 Trusted Online Platforms for buy Ally Bank Banking in 2027
Contact Section:👇👇 ╰┈➤🔎Telegram: Getkycit ╰┈➤🔎 Telegram: Getkycitofficial ╰┈➤🔎WhatsApp: +1 (343) 342-5919 ╰┈➤🌐 Website Visit Now: Getkycit.com
READ ARTICLESafeguarding Your Investment: The Essential Guide to Gutter Replacement in Cibolo
Gutter replacement in Cibolo
READ ARTICLE