
Share:

The Complete Likert Scale Guide: Examples, Tips and Best Practices
- Strongly disagree
- Disagree
- Neither agree nor disagree
- Agree
- Strongly agree
Education or healthcare
How satisfied were you with the explanation of your treatment options?
- Very dissatisfied
- Dissatisfied
- Neither satisfied nor dissatisfied
- Satisfied
- Very satisfied
To turn these Likert scale examples into a real Likert questionnaire, write four to six statements on the same construct rather than a loose set of opinions.
How do you write good Likert items?
Write one idea per statement, label every point, keep the scale balanced and use the same direction throughout the questionnaire.
- One idea per statement."Delivery was fast and well packaged" is two questions. Split it.
- Label every point, not only the ends. Fully labelled scales remove guesswork about what a 2 means.
- Balance the poles. Two positive and two negative options around a real midpoint; never "Poor, Fair, Good, Very good, Excellent" sold as balanced.
- Keep "Don't know" separate from the midpoint, as an off-scale option, so you can exclude it in analysis.
- Watch acquiescence. Long agree-disagree grids invite yes-saying, a form of response bias. Break them up.
Whether a Likert item is the right tool comes first; our comparison of open-ended and closed-ended questions covers that call. For the full wording framework, read how to write good survey questions.
How to analyse Likert scale data
Treat single Likert items as ordinal: report the distribution, median, mode and top-2-box percentage. Summed multi-item scales can reasonably be analysed with means and parametric tests.
This is the oldest argument in the field. Jamieson (2004) argued in Medical Education that Likert categories have an order but no guaranteed equal spacing, so medians, modes and non-parametric tests are the safe choice. Norman (2010) replied that parametric methods such as t-tests, ANOVA and regression hold up well with Likert data, citing studies going back to the 1930s. Both can be right: Jamieson's caution fits single items; Norman's case is strongest for summed scales.
A worked example (illustrative numbers)
Suppose 200 shoppers rate "Checkout was easy" on five points. These figures are made up to demonstrate the calculation, not research data.
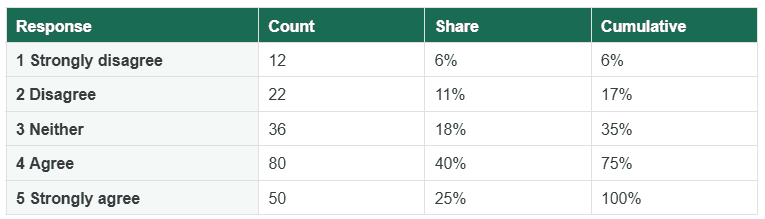
- Median: the 100th and 101st answers both fall in "Agree", so the median is 4.
- Mode:"Agree" (80 responses).
- Top-2-box: 40% + 25% = 65% agree; bottom-2-box is 17%.
- Mean: 3.67, reported beside the distribution, never instead of it.
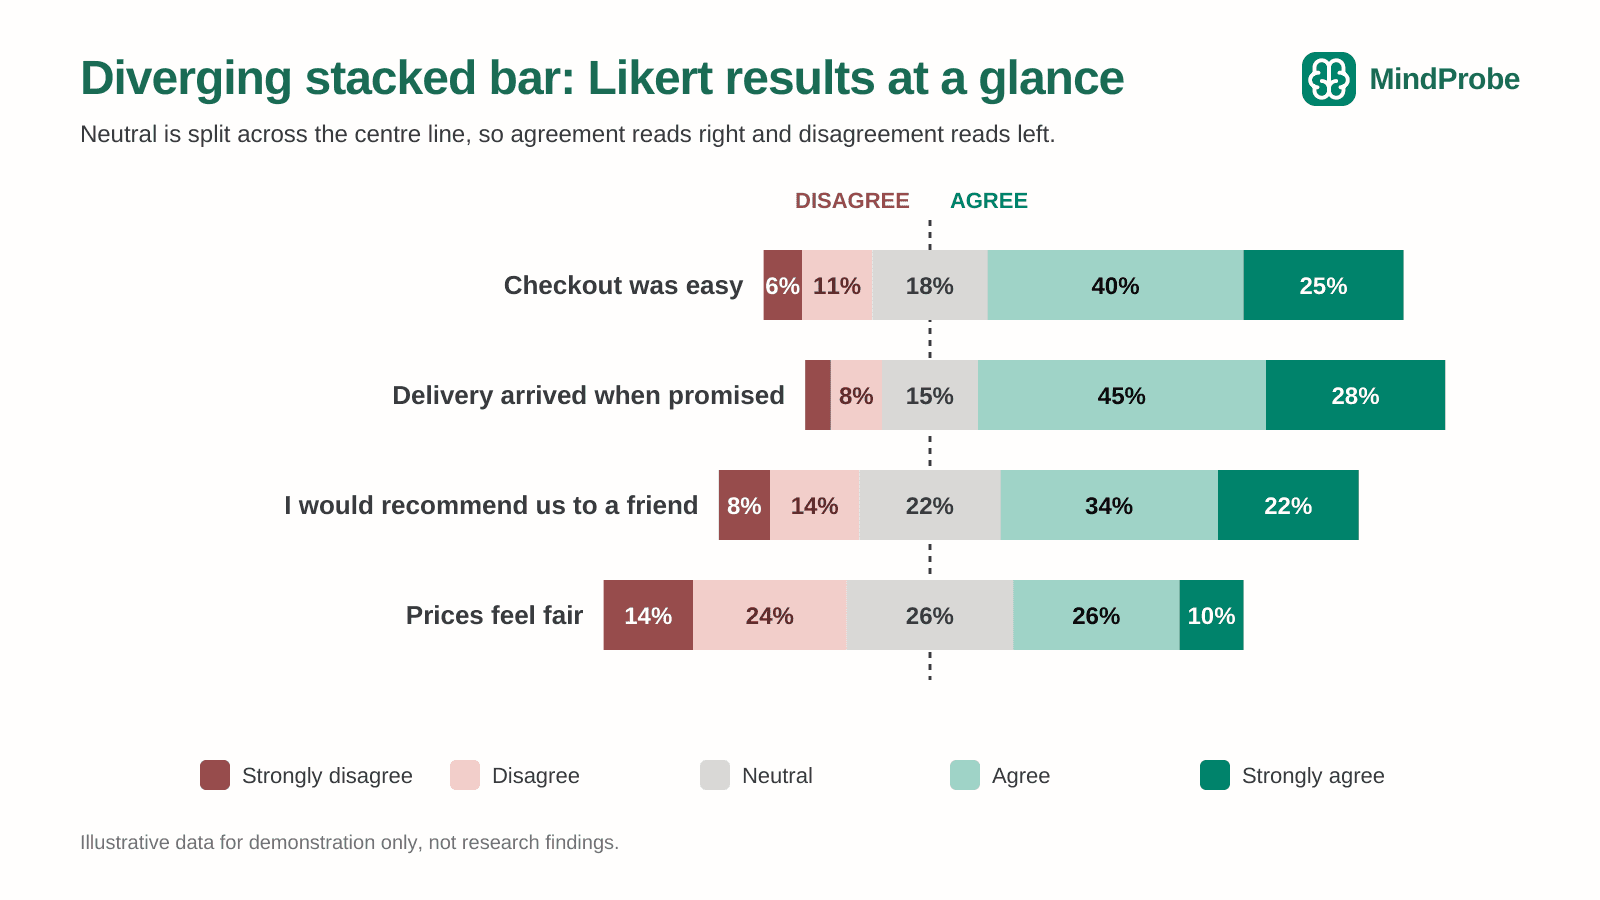
For charts, Heiberger and Robbins (2014) recommend the diverging stacked bar as the primary display for Likert data: neutral sits across a centre line, agreement extends right and disagreement left, so several items compare at a glance. MindProbe's live dashboards can segment that view, say new versus returning customers.
HOW MINDPROBE HELPS
In MindProbe, Likert results update in a live dashboard as responses come in, with the full distribution on show and a split by segment one click away. Add an open "why?" after the item and AI sentiment analysis summarises the reasons behind the scores.
Common Likert scale mistakes (and fixes)
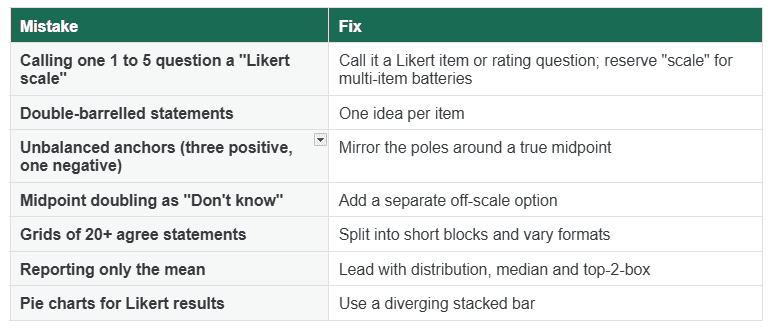
If a question has fixed answers but no natural order, it belongs to a different family; see close-ended question formats.
Share:
More in Travel
View categoryOnline Saudi eVisa Photo Requirements and Submission Guidelines
Applying for a Saudi Arabia eVisa involves submitting a recent photograph that clearly shows the applicant's face and matches the required digital photo guidelines.
READ ARTICLEWhat Distinguishes the Best Legal Minds: A Guide to Top-Tier Immigration Representation
What Distinguishes the Best Legal Minds: A Guide to Top-Tier Immigration Representation
READ ARTICLENavigating the Specialized Challenges of London’s Road Network
Navigating the Specialized Challenges of London’s Road Network
READ ARTICLE